An interactive visualization of the exponential spread of COVID-19
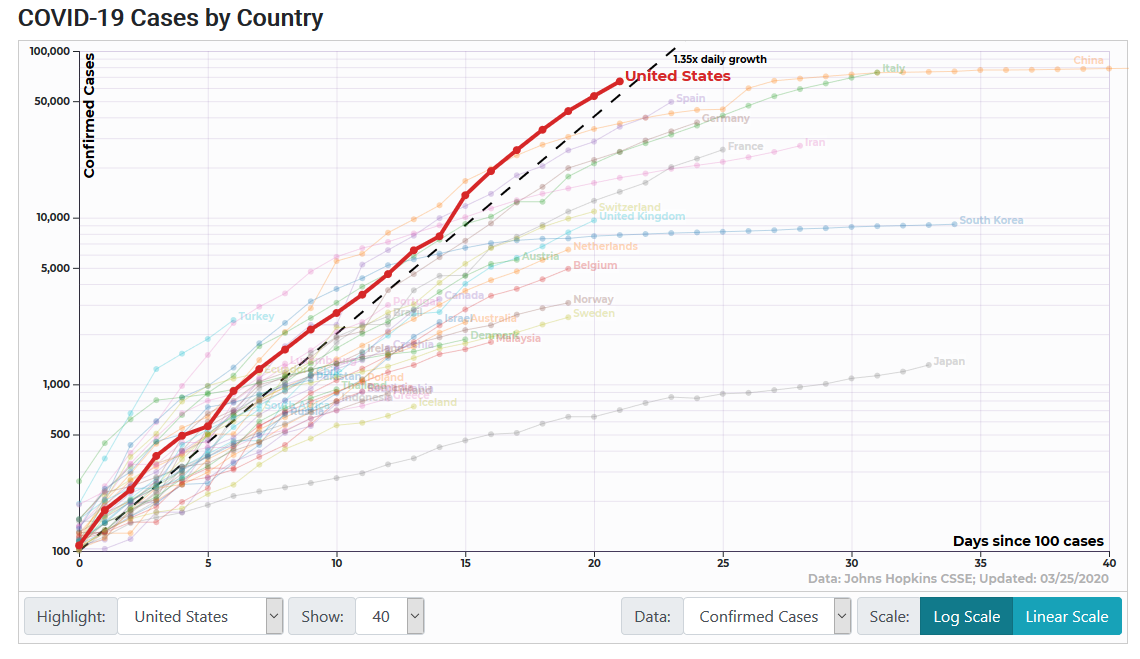
See how the US infection rate looks like a fairly straight line? Yeah…. that ain’t good. On a logarithmic chart like this, “straight line” means “incoming ᛋᚺᛁᛏᛋᛏᛟᚱᛗ thanks to the magic of compound interest.” A daily growth factor of 1.35 works out to a factor of 8.17 per week, or 8,129 in thirty days. There are currently about a thousand dead in the US. What’s one thousand times eight thousand?
In a month, we should be in an interesting new era. Hopefully it’s one where testing and isolation has flattened the growth rate enough that the death rate drops substantially… but given how freakin’ stupid so many people are, holding “COVID Parties” and the like, I wouldn’t bet large sums on the optimistic outcome. That said, the pessimistic outlook will probably mean the death of somewhere around one to two percent of the population. Heartless though it may be to say, most of those lost will likely be of the “economically unproductive” classes, and the country should be able to pick itself back up. But as the Black Death resulted in societal upheaval due to the survivors tossing the prior institutions and partying themselves into the Renaissance, and the Spanish Flu walled the west into the Roaring Twenties, our own Roaring Twenties could be interesting. With luck people will realize the value of self reliance. Concepts such as mass transit, high population density urban centers, gun control, celebrity worship, dependence upon the government will, if there is any wisdom in mankind and justice in the universe, fade away as the bad ideas that they are.